Explorations give you access to data and analytical techniques that aren’t available in reports.
In the world of data analytics, where 2.5 quintillion bytes of data are generated daily with 90% of it created in just the last two years, the appearance of differences between custom explorations and standard reports adds a layer of complexity to the analytical process.
Standard Reports and explorations offer varying perspectives of data, with differences in the level of detail they provide. Certain dimensions and metrics accessible in reports may not be compatible with explorations.
When a report containing unsupported fields is opened in an exploration, those fields are excluded from the exploration. Any visualizations in the report based on unsupported fields, such as a line chart featuring an unsupported metric, will not be present in the resulting exploration. These differences frequently spark our interest while posing concerns about data visualization, accuracy, and interpretation.
Data visualization is a critical component of both approaches. Around 65% of people are visual learners, highlighting the significance of well-crafted visualizations in data analytics.
Customizing nuances and numerous affecting elements is essential before making firm judgments and comprehensively exploring the underlying mechanics.
The realm of Explorations is in one corner, providing a canvas of flexibility and adaptability that enables analysts to create intricate queries, use filters that are as precise as a jeweler’s cut, and define segments that capture the essence of complexity.
The realm of Standard Reports, which frequently adhere to preset patterns and templates and are intended to provide a comprehensive perspective of data trends, is located in the other corner
{{cta(‘147015123633′,’justifycenter’)}}
Get in touch to learn about Analytico’s Digital Analytics Audit services or GA4 audit services.
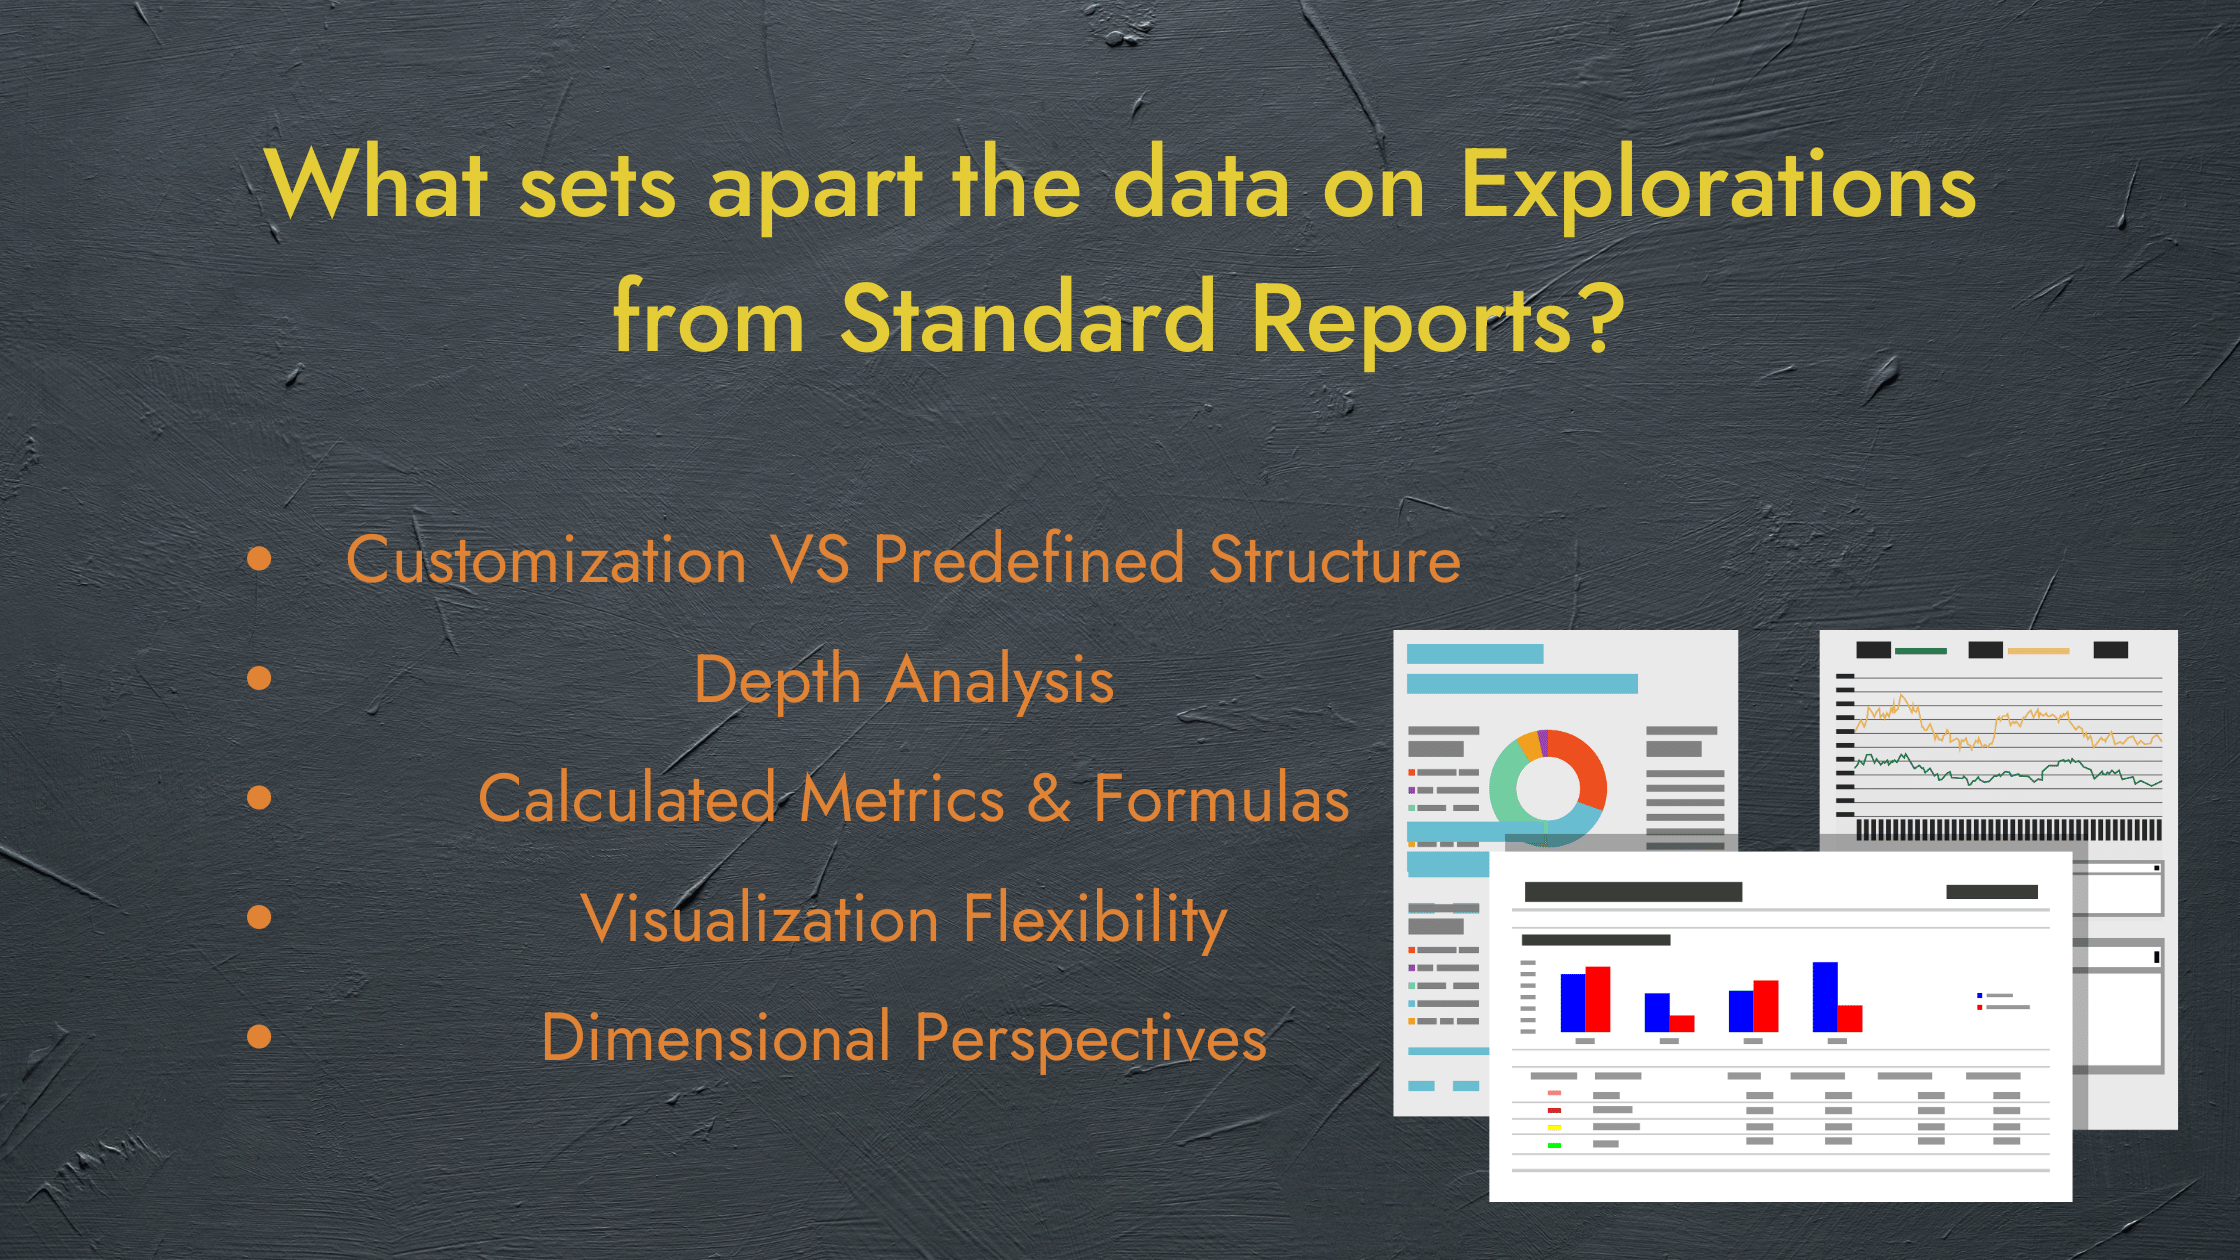
What sets apart the data on Explorations from Standard Reports?
Explorations and standard reports offer distinct ways to extract insights from data sets.
Let’s explore the key differences that set Explorations and Standard reports apart, shedding light on when and how to leverage each approach effectively.
Customization VS Predefined Structure
- Explorations: The ability of explorations to customize is one of its standout features. Analysts can fine-tune queries, use customized filters, and define specific segments to generate insights that align with specific business questions.
- Standard reports: These provide established structures with few opportunities for personalization. They offer quick access to standardized insights, but they might not be able to handle the particular queries in complex data analysis scenarios.
Depth Analysis
- Explorations: Users can navigate the complex network of data interactions via Explorations. Complex relationships can be examined, hidden trends can be found, and nuanced insights that might not be immediately clear. can be seen by analysts.
- Standard reports: Standard reports emphasize immediateness and simplicity, giving a quick overview of data insights without going into great detail on complex correlations. They serve well for simple inquiries that require brief responses.
Calculated Metrics & Formulas
- Explorations: When it comes to computed metrics and unique algorithms, Explorations excel. Unique measures that match particular analytical requirements can be developed by analysts, offering a foundation for innovative research.
- Standard reports: Although Standard Reports provide already calculated metrics, there is little room for creating unique algorithms. This might lead to the omission of nuanced insights that could be captured through explorations’ customized metrics.
Visualization Flexibility
- Explorations: Custom dashboards in Explorations let analysts develop visual narratives catered to certain stakeholders. This personalization makes sure that findings are communicated in the most clear way possible
- Standard reports: While standard reports frequently include visualizations they may not have the same customization choices as the dashboards in Explorations. This could limit the ability to tell a coherent story with data.
Dimensional Perspectives
- Explorations: Explorations give analysts a detailed grasp of how various elements interact by allowing them to investigate data across numerous dimensions and segments. This dimensionality deepens understanding and reveals intricate patterns.
- Standard reports: The scope for examining correlations across numerous variables is constrained by the presentation of insights based on preset dimensions in standard reports. They fail to convey the multidimensional nature of complex business scenarios.
To learn more about the key differences between data in Explorations and Standard Reports, visit
https://www.analytico.ca/blog/what-are-the-explorations-in-google-analytics-4-when-to-use-them
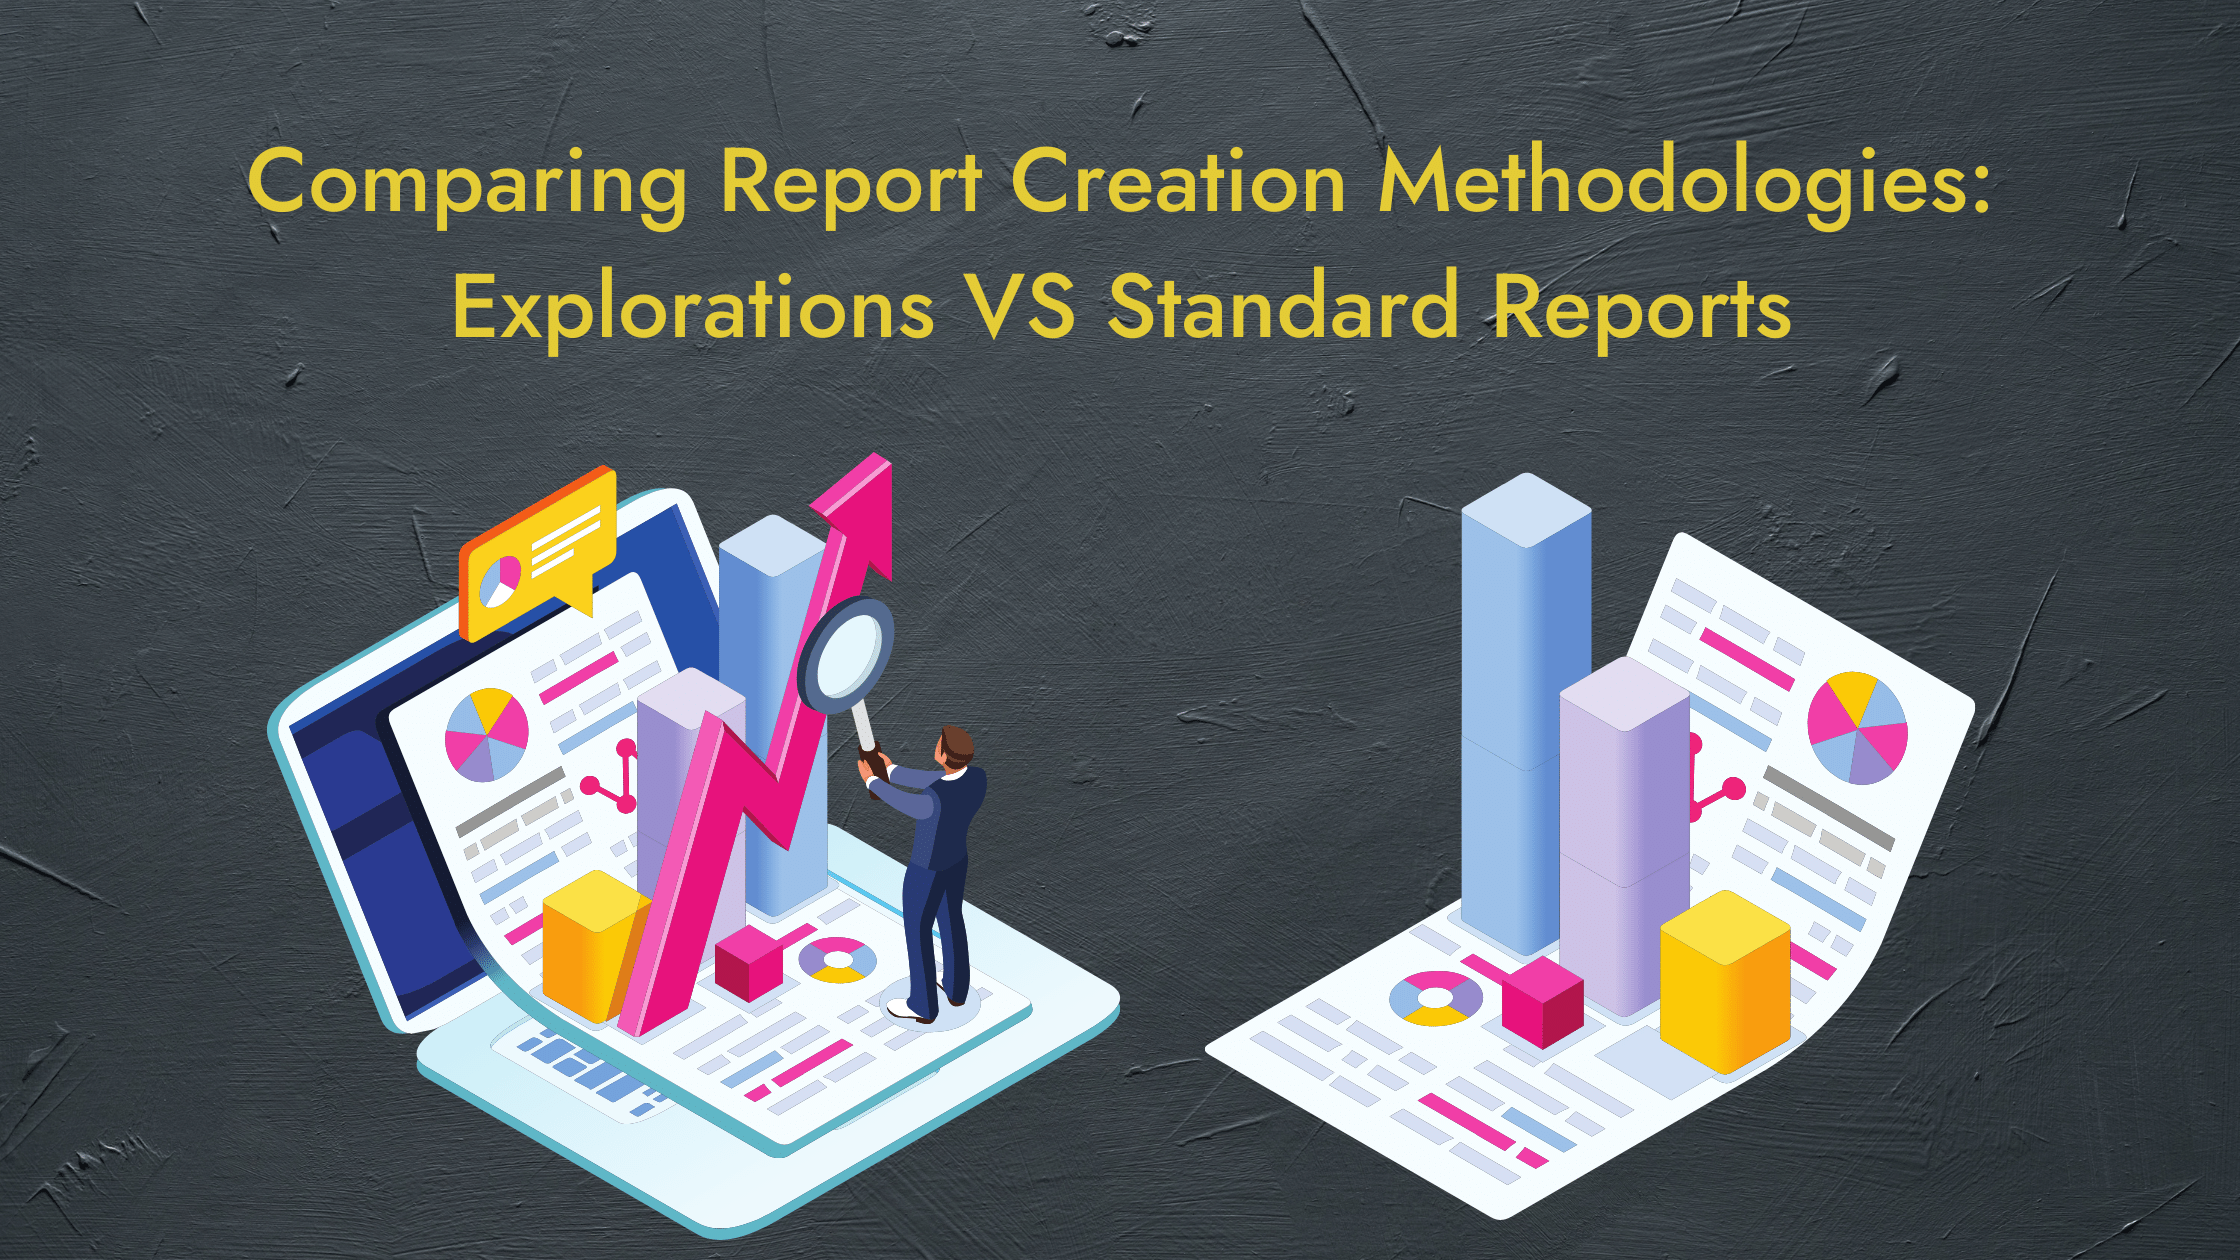
Comparing Report Creation Methodologies: Explorations VS Standard Reports
The table below summarizes the steps involved in creating reports using Explorations and Standard Reports.
|
Step |
Explorations |
Standard report |
|
Access the analytics platform |
Log in to your analytics platform supporting explorations. |
Log in to your analytics platform with standard reports. |
|
Select dataset |
Choose the dataset for analysis. |
Choose the dataset for analysis. |
|
Navigate to section |
Find and select “Explorations” or “Custom analysis”. |
Find and select standard reports” section. |
|
Define objective |
Determine the specific analysis objective. |
Choose a predefined report template. |
|
Craft custom queries |
Create custom queries with dimensions and metrics. |
Predefined metrics and visualizations. |
|
Apply filters and segments |
Narrow data using filters, and define segments. |
Apply_filters (if available) |
|
Incorporate calculated metrics |
Create calculated metrics and custom formulas. |
Utilize predefined calculations. |
|
Design dashboards |
Design custom dashboards for visual communication. |
Explore visualizations in the template. |
|
Review and validate |
Validate queries, filters, and dashboard accuracy. |
Review insights for alignment. |
|
Share and collaborate |
Share insights, and collaborate with stakeholders. |
Share findings and discuss implications. |
|
Limited customization |
A high degree of customization and flexibility. |
Limited customization within the template. |
Differences in Data Retention between Explorations and Standard Reports and its Implications:
Data storage and upkeep within an analytics platform or system are referred to as data retention. Explorations and standard reports retain data differently, which may have an impact on the level of analysis, historical insights, and overall decision-making.
The difference between the two approaches’ data retention is explained as follows:
Data Retention in Explorations
Data Depth & Analysis Duration
Data retention is typically longer and more comprehensive in Explorations.
Due to the in-depth nature of explorations, historical data is often kept on the platform for a longer period.
With the help of this extended retention, analysts can investigate trends, patterns, and linkages over a considerable amount of time, which enables them to uncover insights that might span across various periods.
Holistic Historical Context
Explorations place a high priority on providing a comprehensive historical context. This means that analysts can examine data not only from recent periods but also from months or even years in the past.
This extended data retention allows Organizations to now track long-term trends, analyze seasonality, and base choices on past trends.
Resource Allocation & Storage Costs
Explorations’ extensive data retention, may necessitate the allocation of additional resources and storage space.
A strong infrastructure is required to successfully maintain and process massive volumes of historical data as it grows
Data Retention in Standard Reports
Focused & Current Insights
Standard Reports often prioritize providing current and up-to-date insights rather than comprehensive historical analysis. As a result, standard reports’ data retention term can be shorter than explorations’.
Insights from these studies are intended to reflect current trends and changes, making them suitable for quick decision-making.
Real-Time Updates
As data changes, Standard Reports excel at displaying real-time updates. These reports’ emphasis is on providing insights based on the most recent information available because they are intended to facilitate quick decision-making.
As older data becomes less important for the main goal of these reports, this immediate update frequency may result in shorter data retention durations.
Efficient Resource Utilization
A smaller dataset must be managed and stored by the platform, therefore the Standard reports’ shorter data retention term can help with optimal resource utilization.
The objective of providing immediate and current information is well-aligned with this streamlined strategy
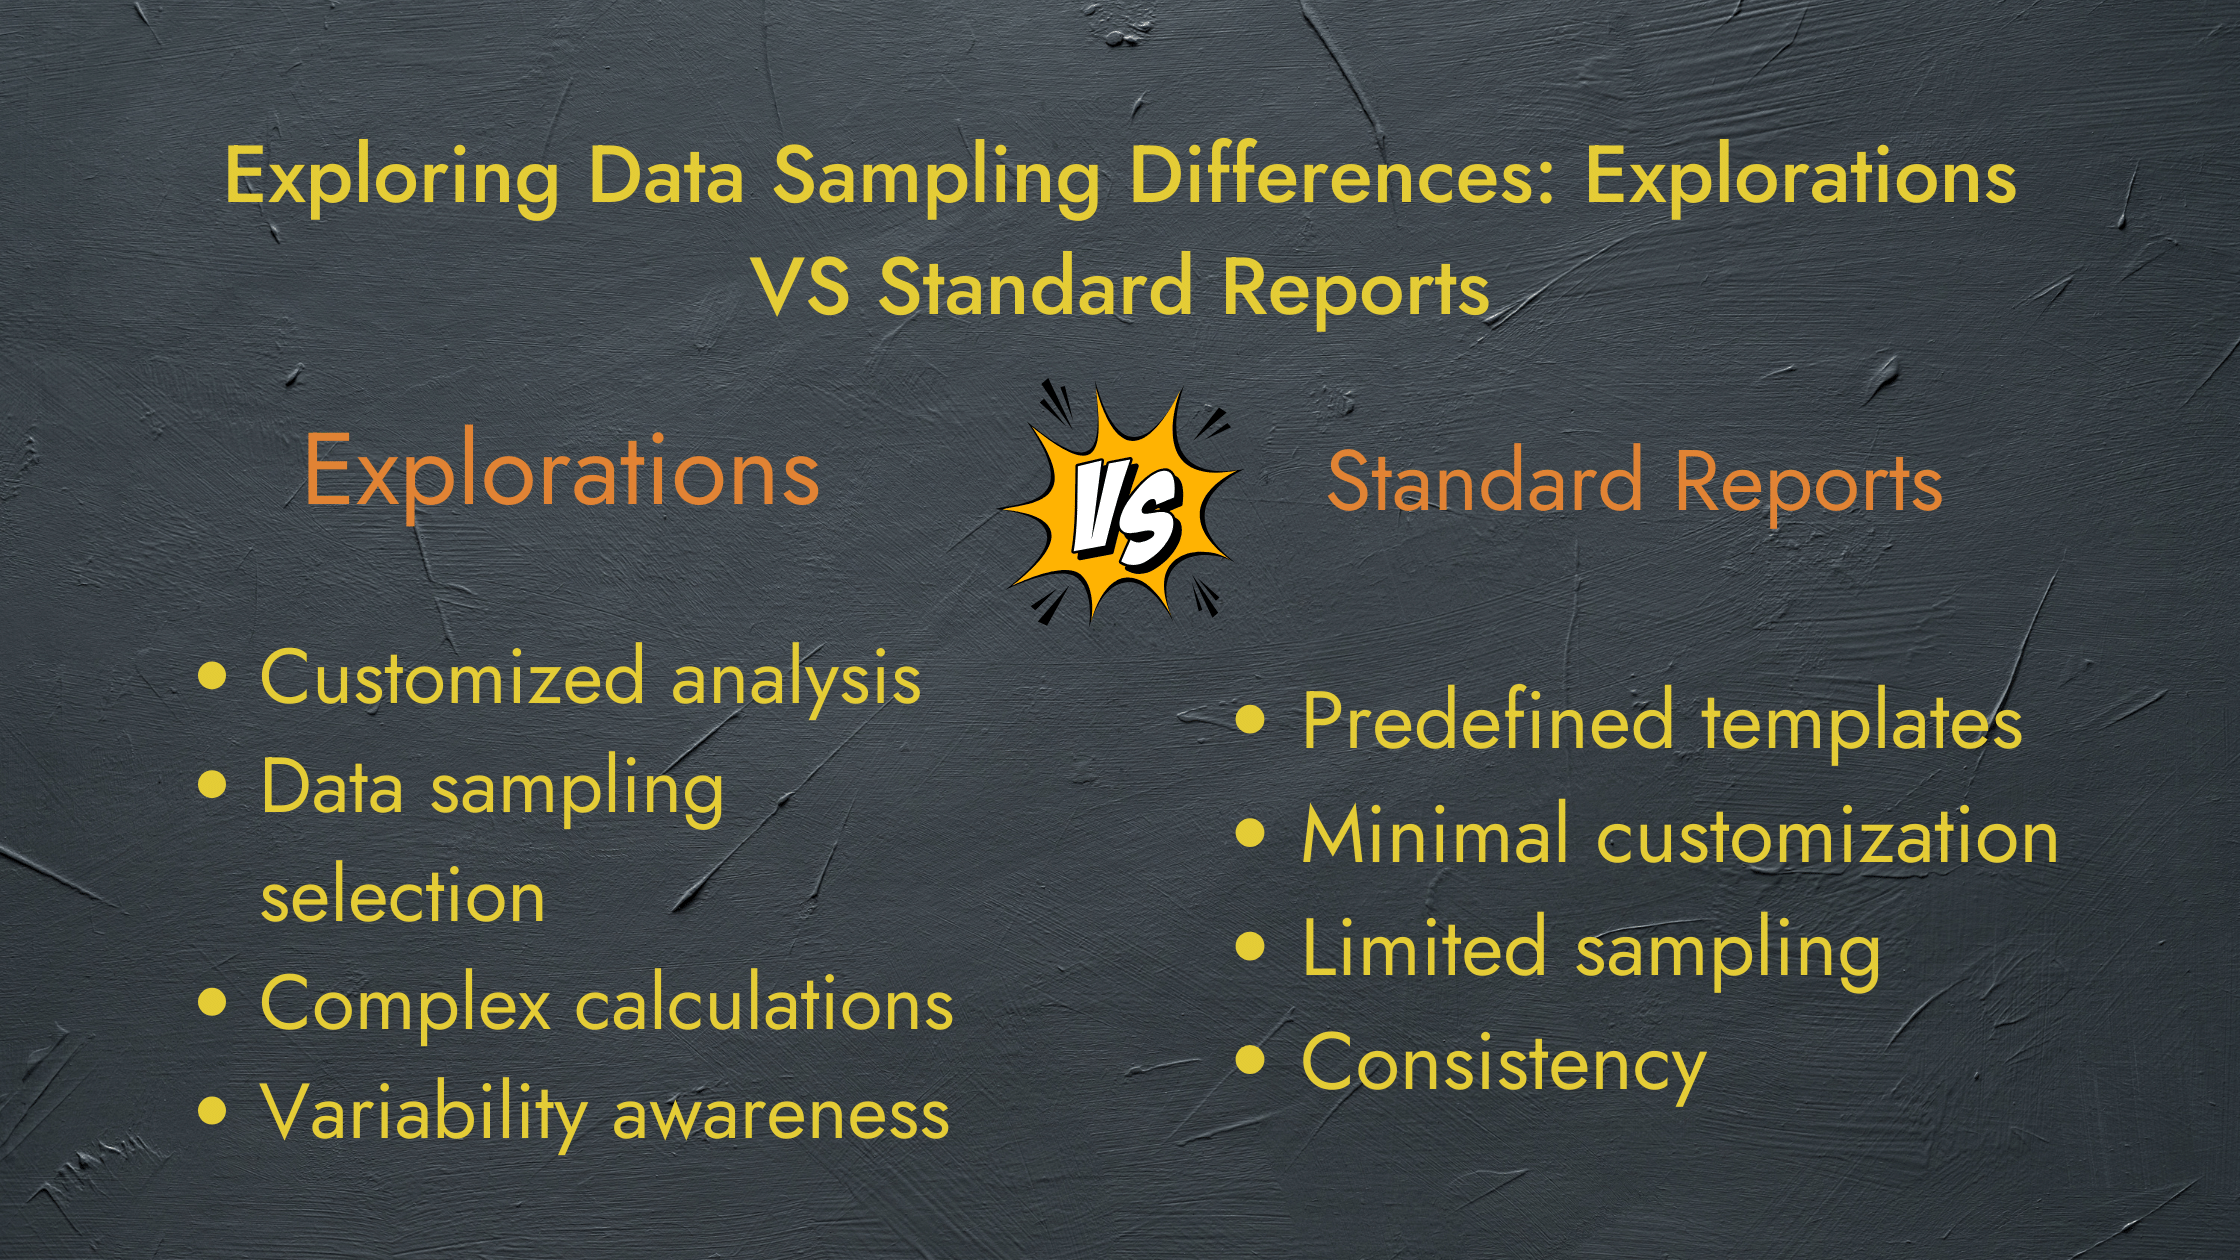
Exploring Data Sampling Differences: Explorations VS Standard Reports
Data sampling acts as a crucial tool to extract insights efficiently, However, its application varies between Explorations and Standard Reports.
Enlisted below are some key differences in Data Sampling between Explorations and Standard Reports:
Explorations
Data sampling in Explorations is primarily driven by the need to efficiently analyze large and complex datasets while maintaining a reasonable processing time. Explorations prioritize customized, in-depth analyses tailored to specific business questions.
Here’s how data sampling works within the context of explorations
-
Customized analysis: Explorations allow you to create tailored queries, apply filters, and define segments to address specific analytical objectives.
-
Data sampling selection: When the dataset is substantial, Explorations might employ data sampling to ease analysis. Sampling methods like random, stratified, or systematic sampling are used to select a subset of data points.
-
Complex calculations: Explorations often involve intricate calculations and dimensional exploration. Sampling helps manage the computational load while enabling deep analysis.
-
Variability awareness: When interpreting results from sampled data in Explorations, it’s essential to remain aware of potential variability introduced by sampling.
Standard Reports
Standard reports on the other hand emphasize predefined insights that cater to quick decision making. These reports generally aim to provide a standardized view of data across different users.
Here’s how data sampling works within the realm of standard reports:
-
Predefined templates: Standard Reports come with predefined report templates that offer specific insights or KPIs
-
Minimal customization: While filters might be available, Standard reports prioritize which access to insights without extensive customization.
-
Limited sampling: Standard Reports usually do not involve extensive data samples. Instead, they focus on presenting insights based on the entire dataset, providing a consistent view to all users.
-
Consistency: By avoiding Data sampling, Standard Reports ensure that all users receive the same insights, fostering consistent decision-making across the organization.
|
Note to Remember The variations in Data retention and sampling can significantly impact the depth of analysis, historical insights, and decision-making strategies across both methodologies |
Conclusion
In the world of data analytics, explorations, and standard reports offer distinct analytical approaches. explorations provide customized, detailed insights while standard reports prioritize standardized, quick decisions.
These differences arise from their methodologies, impacting data sampling, customization, data retention, and complexity.
Despite these distinctions, both methods have their roles in shaping informed decisions and navigating a data-rich landscape, highlighting the value of mastering these approaches for a data-driven future.
Be updated with our blogs to find more information on Google Analytics.


