Do you scramble to manage and process raw data in a more organized format? Wishing it was more simplified. Try Semantic Models in Power BI.
Your next question will be, what are semantic models in Power BI?
These models transform raw data into an organized and structured format making it much easier to handle, analyze, visualize, and draw data-driven insights.
So, dive into our comprehensive guide on Semantic models in Power BI and learn how to get more out of your data.

Get in touch to learn about Analytico’s Digital Analytics Audit services or GA4 audit services
What are Semantic Models in Power BI?
Semantic models in Power BI serve as a structured layer that abstracts the complexities of raw data, transforming it into a more understandable and user-friendly format.
Initially, it was called data sets but was renamed to cover the breadth of what was on offer.
These models provide a unified representation of business data by organizing it into entities, such as tables, columns, measures, and relationships.

A semantic model is an intermediary between the raw data and the end users, allowing for intuitive data exploration and reporting. It encapsulates business logic, definitions, and calculations, making data analysis more accessible to technical and non-technical users.
Read this blog to learn why business intelligence consultants use Microsoft Power BI.
How Semantic Models Fit Within the Power BI Ecosystem?
Semantic models in Power BI play a pivotal role in bridging the gap between data sources and end-user analytics.
Power BI supports various data connectivity modes, including imported data, DirectQuery, and composite models, each with its implications for semantic modeling.
- Integration with Data Sources: Semantic models in Power BI can integrate with a wide range of data sources, including databases, cloud services, and on-premises systems. This integration ensures that data from diverse sources can be unified under a single, coherent model.
- Centralized Business Logic: By encapsulating business rules, calculations, and definitions within the semantic model, Power BI ensures that these rules are consistently applied across all reports and dashboards. This centralization simplifies maintenance and updates, as changes to business logic only need to be made in one place.
- Role in Self-Service BI: Semantic models empower self-service BI by enabling business users to create their own reports and analyses without needing deep technical knowledge. This aligns with Power BI’s goal of making data analytics accessible to everyone within an organization.
- Collaboration and Governance: Semantic models support collaboration by allowing multiple users to work on the same data model. They also facilitate governance by providing a controlled environment where data quality and consistency are maintained, ensuring reliable and accurate analytics.
Key Components of Power BI Semantic Models
The Microsoft Power BI Semantic models consist of three key components, these include:
- Semantic Model Modes
- Data Flows
- Data Modeling
Semantic Model Modes in Power BI
Modes in Power BI are collections of data imported or connected to the Power BI service, forming the foundation of reports and dashboards.
A mode contains information from one or more data sources and is structured to facilitate data analysis and visualization.
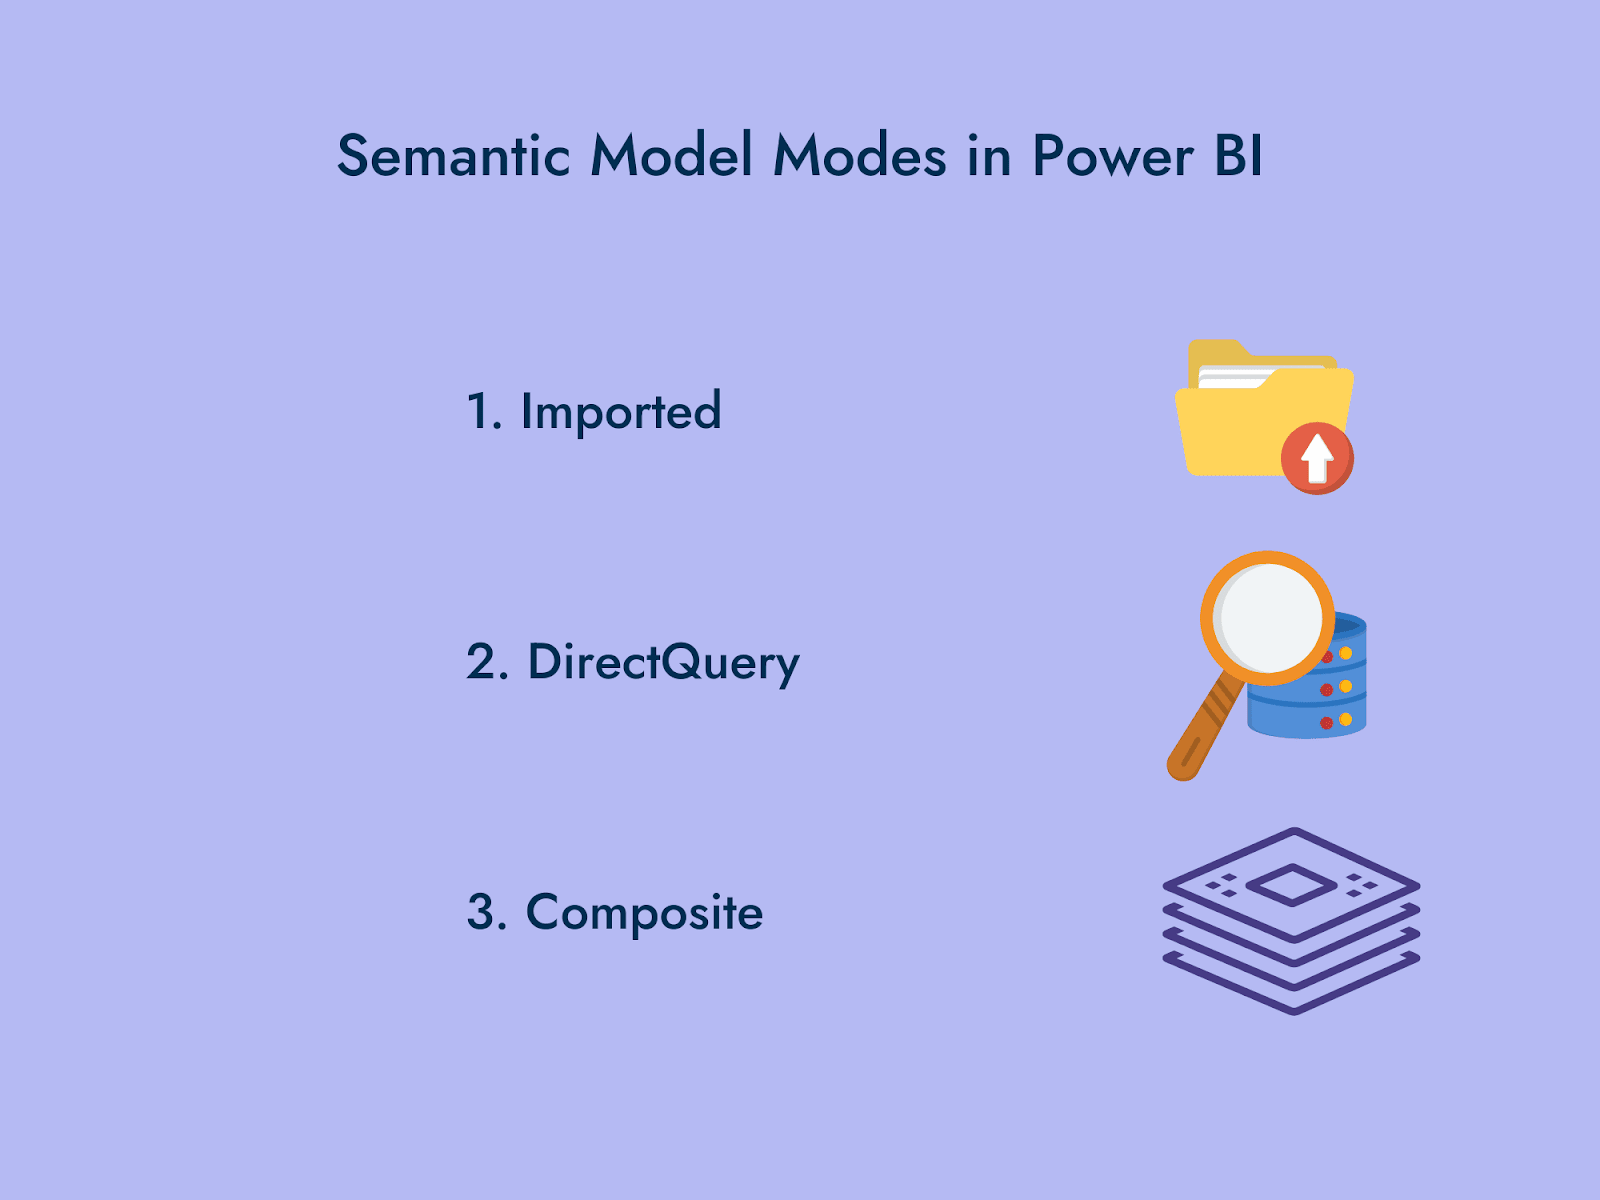
Power BI uses three types of Semantic Model Modes:
- Imported: Data is loaded into Power BI’s in-memory storage. This approach provides high performance because the data is stored locally and is quickly accessed for analysis. Imported datasets are ideal for scenarios where data needs to be frequently queried and analyzed.
- DirectQuery: In this mode, Power BI queries the data source in real time without storing the data in Power BI.
This is useful for large datasets that cannot be fully loaded into memory or for situations where the data needs to reflect real-time changes. However, performance may depend on the underlying data source’s capabilities.
- Composite: Composite mode combines the benefits of imported data and DirectQuery. It allows users to mix and match tables that are imported and tables that are queried in real-time. This flexibility helps optimize performance and manage large datasets effectively.
How do Semantic Modes Relate to Semantic Models?
Modes are integral to semantic models as they contain the raw data that semantic models structure and organize. The dataset forms the first layer, where data is gathered, cleaned, and prepped. The semantic model builds on this layer by defining relationships, hierarchies, and calculations, turning raw data into meaningful insights.
Dataflow and Their Role in Power BI
Dataflows in Power BI are a means to ingest, transform, and prepare data. They allow users to define data transformation steps using Power Query, which can be reused across multiple reports and dashboards.
Dataflows are particularly useful for ETL (Extract, Transform, Load) processes, enabling data to be cleaned and shaped before being loaded into a dataset.
Dataflows feed into semantic models by providing a prepared and transformed set of data that can be used to build datasets.
They serve as a pre-processing layer that ensures data consistency and quality before it enters the semantic model. This connection ensures that the data model is built on a robust foundation of clean, well-structured data.
Data Modeling
This is the meaty section where all the action takes place.
Data modeling is crucial in Power BI as it defines how data is structured and related within the dataset. A well-designed data model ensures data is organized enough to support accurate and efficient analysis.
It takes data from the previous two stages to define relationships, hierarchies, and business logic that transform raw data into meaningful insights.
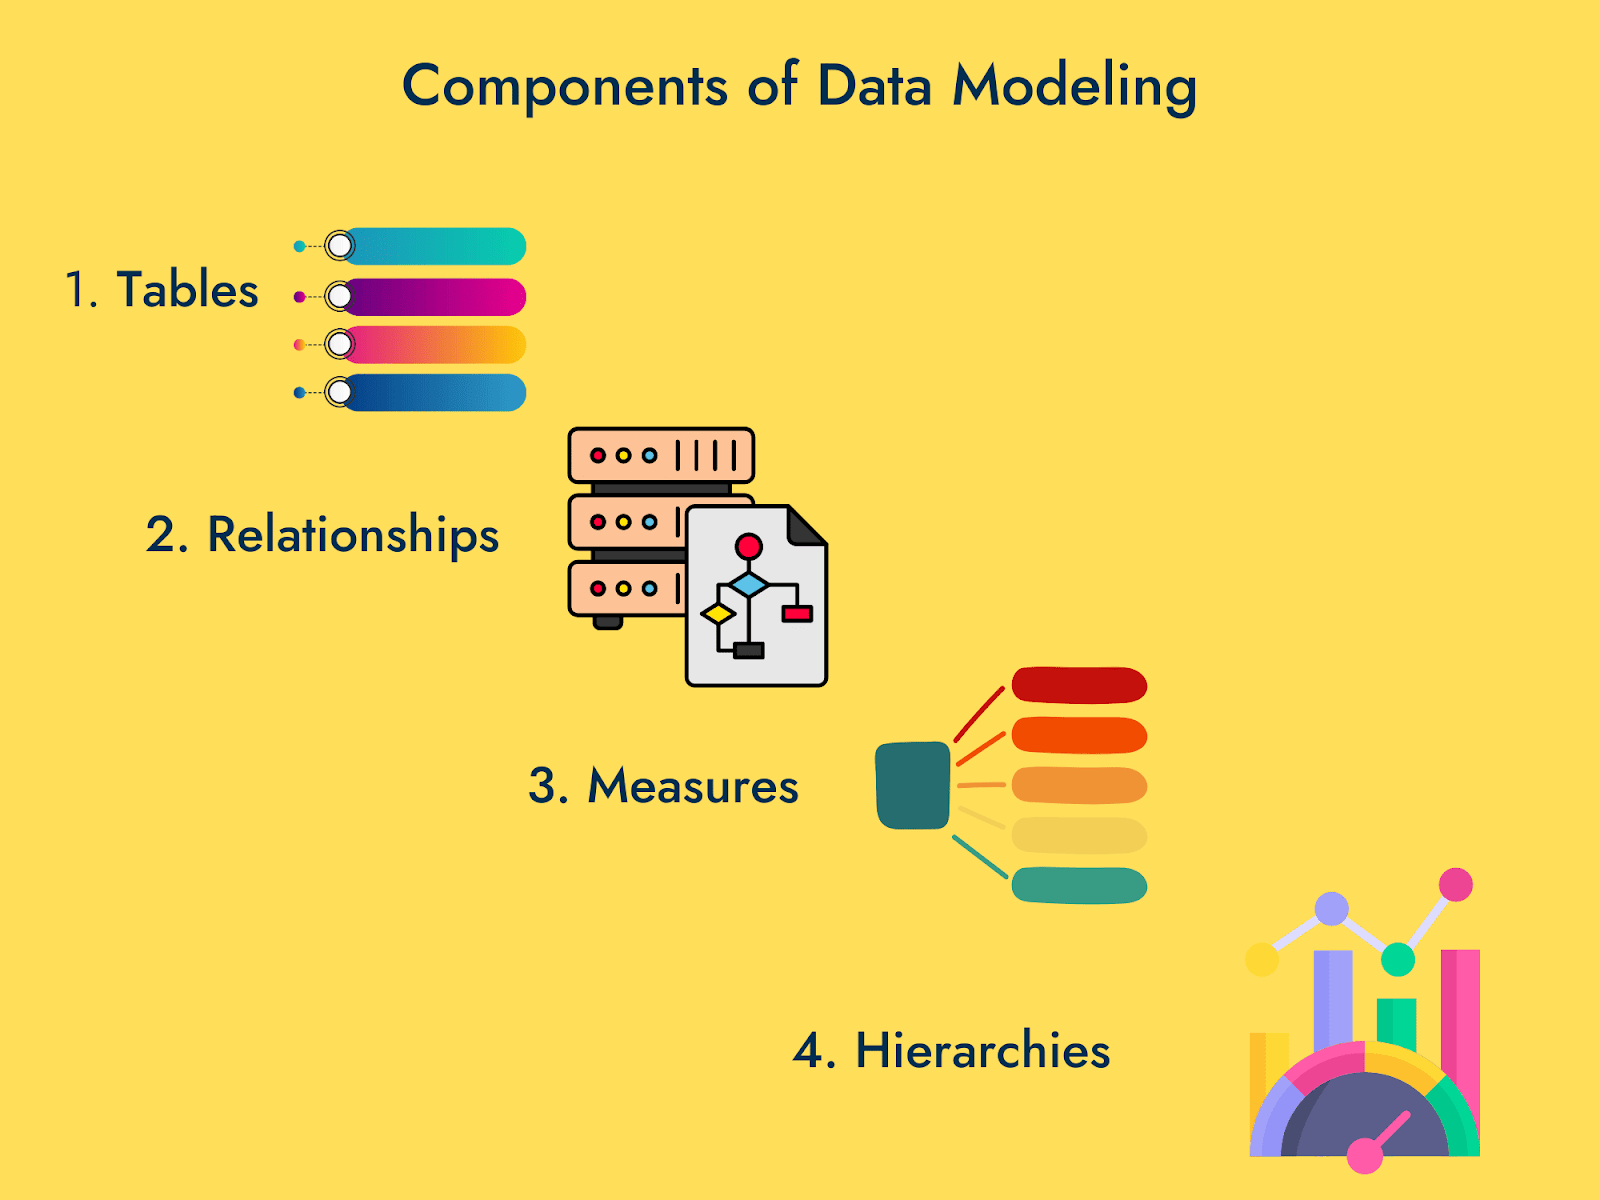
Components of Data Modeling
- Tables: Tables are the fundamental components of a data model. They represent collections of data organized in rows and columns. Each table corresponds to a dataset or part of a dataset.
- Relationships: Relationships define how tables are connected. They are essential for creating a coherent data model where users can query across multiple tables seamlessly. Power BI supports various relationships, including one-to-one, one-to-many, and many-to-many.
- Measures: Measures are calculations used to aggregate data, such as sums, averages, or counts. They are defined using DAX (Data Analysis Expressions) and are vital for creating dynamic and interactive reports.
- Hierarchies: Hierarchies organize data into levels, such as Year > Quarter > Month. They allow users to drill down into data, providing a deeper understanding of trends and patterns over time or other dimensions.
Building a Semantic Model in Power BI
Now that we understand the structure and workings of Semantic models in Microsoft Power BI it is time to build one.
Steps to Create a Semantic Model
1. Import Data
The first step in building a semantic model in Power BI is importing data from various sources.
Power BI supports a variety of data sources, including Excel files, SQL Server databases, cloud-based services like Azure, and many others.

To import data, follow these steps:
- Launch Power BI Desktop to begin the data import process.
- Click on the “Get Data” button on the Home ribbon. This opens a dialog box where you can select your data source.
- Choose the appropriate data source and follow the prompts to connect. For instance, if you are importing data from an Excel file, navigate to the file and select it.
- Once connected, you can preview and select the tables or queries you want to import. Click “Load” to bring the data into Power BI.
2. Define Relationships
After importing data, the next step is to define relationships between tables. Relationships link different tables, allowing you to create comprehensive reports that draw data from multiple sources.

Here’s how to define relationships:
- Switch to the Model view by clicking the Model icon in the left-hand navigation pane.
- Drag fields from one table to another to create a relationship. For example, if you have one sales table and a customer table, you might link the CustomerID field in both tables.
- Double-click on the relationship line to open the Edit Relationship dialog box, where you can adjust the relationship type and cardinality (e.g., one-to-one, one-to-many).
3. Create Measures and Calculate Columns
Measures and calculated columns are essential for performing calculations and aggregations within your data model.

Measures are typically used for calculations that aggregate data, while calculated columns are used for row-level calculations.
- In the Fields pane, right-click on the table where you want to create the measure and select “New Measure“. Use DAX (Data Analysis Expressions) to define your measure.
For example, to calculate total sales, you might use a formula like Total Sales = SUM(Sales[SalesAmount]).
- Similarly, right-click on the table and select “New Column“. Define your calculated column using DAX.
For example, to calculate a 10% discount on sales, you might use Discounted Sales = Sales[SalesAmount] * 0.9.
4. Build Hierarchies
Hierarchies organize your data into different levels, making it easier to drill down and analyze data across dimensions. For example, you may create a date hierarchy that includes Year, Quarter, Month, and Day.

- In the Fields pane, right-click on the field you want to start the hierarchy with (e.g., Year) and select “New Hierarchy“.
- Drag other related fields (e.g., Quarter, Month) into the new hierarchy. This creates a nested structure that users can expand or collapse in reports.
- Use the hierarchy in your reports to allow users to drill down into the data by different levels.
5. Publish Model
Once built, test your model for smooth running against expected performance and desired results. See if clean, recent, and quality data was used to create the model.
If it checks all the boxes publish the semantic model in Power BI Service.
Best Practices for Data Modeling in Power BI
Make the most of your Semantic models in Power BI by implementing these industry best practices.
- Keep your data model as simple as possible. Avoid unnecessary complexity by removing redundant tables and columns.
- Use clear and consistent naming conventions for tables, columns, and measures. This makes the model easier to understand and maintain.
- Ensure consistent definitions for metrics and dimensions. Establish a single source of truth for key business metrics to avoid discrepancies in reporting. Document and standardize data definitions and calculations within the semantic model.
- Optimize your model’s performance by carefully selecting the data you import and using DirectQuery or composite models for large datasets. Reduce the amount of data by using filters and aggregations where possible.
- Ensure the quality of your data before importing it. Clean and preprocess data to remove duplicates, handle missing values, and standardize formats. Regular audits and monitoring can help identify and address data quality issues promptly.
- Document the purpose and logic of your measures, calculated columns, and relationships. This is especially important in collaborative environments where multiple users may work on the same model.
- Set up regular data refresh schedules to keep the data current. For Import mode, ensure the refresh schedules align with the frequency of data updates. For DirectQuery and Composite modes, monitor and optimize query performance regularly to maintain efficiency and accuracy.
- Conduct thorough testing before deploying semantic models, to ensure accuracy and performance. Regularly review and update the model to adapt to changing business needs and data environments.
- Implement role-based security to control access to sensitive data. Use Power BI’s security features to restrict data access based on user roles.
Use Cases and Applications of Semantic Models in Power B
1. Business Reporting
Semantic models in Power BI enable organizations to ensure all reports use the same definitions and calculations, which enhances data accuracy and consistency across the departments.
For example, a retail company might use a semantic model to unify sales data from multiple regions and stores.
This model could integrate data from point-of-sale systems, inventory databases, and customer relationship management (CRM) platforms, providing a comprehensive view of sales performance.
2. Financial Analysis
Financial institutions and departments can leverage these models to consolidate data from disparate financial systems, such as general ledgers, budgeting tools, and transactional databases.
A semantic model allows for the creation of standardized financial metrics like net income, return on investment (ROI), and cash flow analysis.
For example, a multinational corporation could use a semantic model to harmonize financial data from different subsidiaries, providing a unified view for quarterly earnings reports and strategic planning.
3. Operational Analysis
Operational analytics benefits significantly from semantic models by enabling real-time insights into operational performance.
Manufacturing companies, for example, can use semantic models to integrate data from production lines, quality control systems, and supply chain management tools.
This integration allows the monitoring of key performance indicators (KPIs) such as production efficiency, defect rates, and supply chain lead times. Semantic models enable these companies to quickly identify and address operational issues, improving efficiency and reducing costs.
Benefits of Using Semantic Models for Different Business Scenarios
1. Consistency and Accuracy
Semantic models ensure that all users across an organization work with the same data definitions and calculations, which is crucial for consistency and accuracy in reporting. This uniformity reduces the risk of discrepancies and errors arising when different departments or teams use varying data sources and definitions.
2. Enhanced Decision-Making
Semantic models facilitate better decision-making by providing a unified view of data.
Decision-makers can access comprehensive and up-to-date information without needing to reconcile data from multiple sources.
This holistic view is particularly beneficial in scenarios such as strategic planning, where a complete understanding of the organization’s performance is essential.
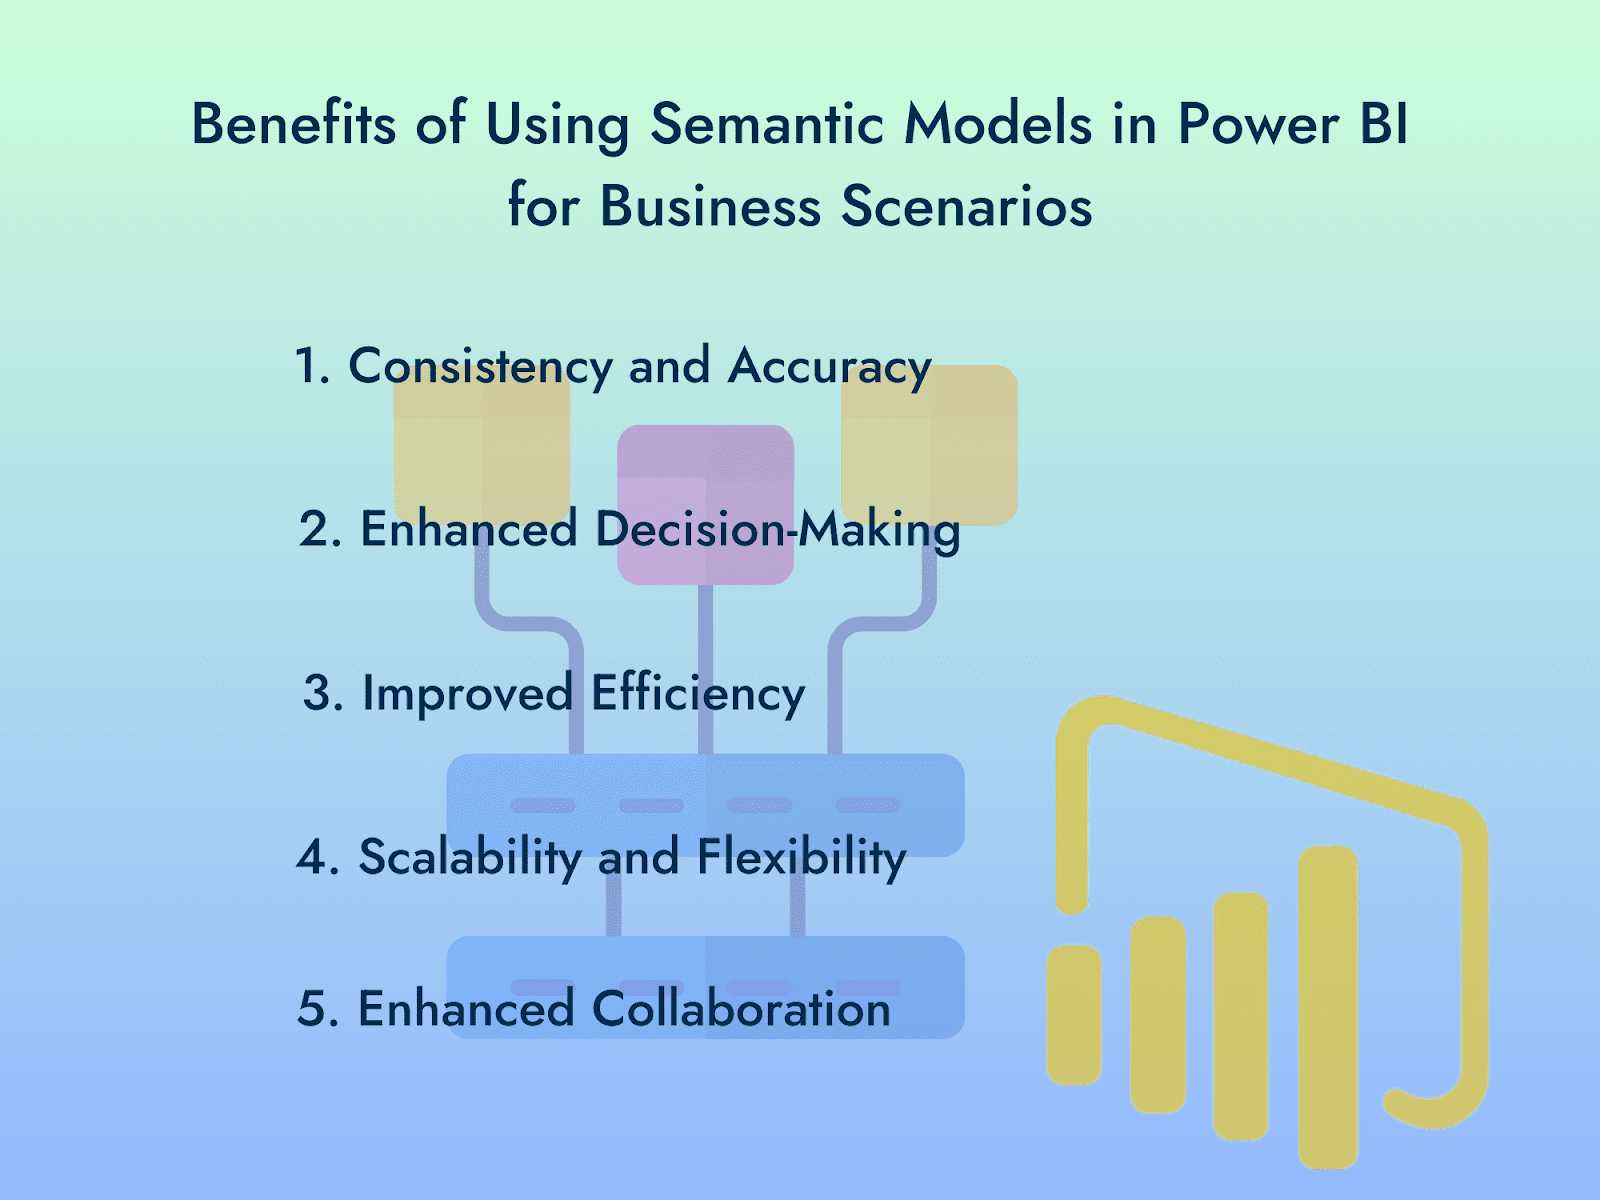
3. Improved Efficiency
Semantic models streamline data analysis by reducing the need for manual data integration and preparation. This efficiency is achieved through the centralized management of data relationships, measures, and hierarchies.
As a result, analysts and business users can spend more time on value-added activities, such as interpreting data and making strategic recommendations.
4. Scalability and Flexibility
The modular nature of semantic models allows organizations to scale their data analytics efforts easily. As business needs evolve, new data sources and metrics can be incorporated into existing models without extensive rework.
This scalability ensures that the semantic model can grow with the organization and adapt to changing requirements.
5. Enhanced Collaboration
Semantic models promote collaboration by providing a single source of truth for all users.
Teams can work together more effectively knowing they use the same data and metrics.
This collaborative environment is valuable for cross-functional projects, where input from multiple departments is necessary to achieve common goals.
Advanced Features and Techniques
Power BI allows users to improve the performance and reliability of their semantic models through some of its advanced features. We will discuss some in this section.
Role-Level Security
Role-Level Security (RLS) in Power BI is a feature that restricts data access for specific users based on their roles.

This ensures that sensitive information is only accessible to authorized individuals, enhancing data security and compliance.
RLS is particularly important in scenarios where different users or groups need to see only the data relevant to them, such as sales regions, departments, or individual employee data.
How to Implement Role-Level Security in Semantic Models?
Follow the steps below to implement role-level security in your Power BI semantic models.
- Go to Power BI Desktop’s “Modeling” tab and select “Manage Roles.” Here, you can create new roles and define DAX filters to specify the data each role can access.
- You can write DAX expressions for each role to filter the data. For example, you might use a filter like [Region] = “North America” to restrict sales data by region.
- After defining roles, you can test them by selecting “View As Roles” to ensure the data is correctly restricted based on the role definitions.
- Once the roles are set up, publish the Power BI report to the Power BI service. In the Power BI service, go to the dataset settings, select “Security,” and assign users or groups to the appropriate roles.
Performance Optimization
Organizations can follow these tips for optimizing the performance of semantic models:

- Simplify your data model by removing unnecessary tables and columns. Use star schema design where possible to improve query performance.
- Limit the amount of data imported by using query parameters and filters to bring only the data needed for your analysis.
- Opt for aggregations to pre-summarize data at different levels of granularity, which can significantly speed up query performance.
- Optimize data storage and retrieval with indexes and partitions, especially in DirectQuery mode.
Challenges in Building and Managing Semantic Models
Some common issues arising while building and maintaining semantic models in Microsoft Power BI include:
1. Complex Data Integration
One of the primary challenges in building semantic models is integrating data from multiple sources. Each source may have different structures, formats, and levels of data quality.
Ensuring these disparate data sources harmonize into a cohesive model can be time-consuming and technically challenging.
2. Performance Issues
As the volume and complexity of data increase, performance can become a significant concern.
Large datasets and complex calculations can slow down query response times, impacting the user experience. Choosing the appropriate model mode (Import, DirectQuery, Composite) is critical for balancing performance with data freshness and size.
3. Managing Data Relationships
Defining and managing relationships between different tables is another challenge. Incorrectly set relationships can result in inaccurate results and complex debugging processes.
Ensuring all relationships are correctly defined and maintained requires a deep understanding of the data and careful planning.
4. Security and Governance
Implementing robust security measures such as Role-Level Security (RLS) is essential but complex to set up and manage, especially in large organizations with many users and varied data access needs.
Ensuring data governance and compliance with regulatory requirements adds another layer of complexity.
Considerations for Choosing the Right Data Mode
Users should consider the following issues before selecting their data mode to build semantic models in Power BI.
1. Data Freshness vs. Performance
When choosing between Import, DirectQuery, and Composite modes evaluate the trade-off between data freshness and performance.
Import mode offers the best performance but may not provide the most current data. DirectQuery ensures real-time data access but can suffer from slower performance, especially if using an unoptimized underlying data source. Composite mode offers a balance but requires careful management to optimize both aspects.
2. Data Volume and Storage
Consider the volume of data and available storage.
Import mode stores data in memory, which is limited by hardware constraints. DirectQuery mode does not store data in Power BI, making it suitable for large datasets but dependent on the performance of the data source.
Composite mode allows for flexibility but needs to be designed carefully to manage storage and performance trade-offs.
3. Complexity of Calculations
Evaluate the complexity of the calculations required. Import mode supports a wider range of DAX functions and more complex calculations, while DirectQuery mode has limitations. Composite mode can mitigate these limitations using imported data for complex calculations and DirectQuery for up-to-date data access.
Conclusion
This blog was a comprehensive guide answering the query; “What are semantic models in Power BI.”
Semantic models within Microsoft Power BI transform raw data into structured, user-friendly formats that facilitate robust data analysis and visualization.
These models abstract the complexities of raw data also integrating business logic, ensuring consistent and accurate insights across an organization.
They achieve this by organizing data into entities like tables, columns, and measures, bridging the gap between data sources and end-user analytics, and enhancing data exploration and reporting capabilities.
We also discussed the various advanced features and techniques for optimizing semantic models, such as Role-Level Security and performance optimization, and the value of choosing the right data mode for your needs.
Understanding the challenges and considerations for building and managing semantic models is crucial for maximizing their potential.
As organizations strive for more data-driven decision-making, mastering semantic models in Power BI can lead to more efficient operations, better insights, and ultimately, a competitive edge in the market.
Like what you read? Learn more about Digital Analytics on our blog here.


