In the ever-evolving landscape of digital marketing and e-commerce, understanding customer behavior is paramount. Google Analytics 4 (GA4), the latest iteration of Google’s analytics platform, offers a range of tools designed to provide deep insights into user interactions. One of the key features of GA4 is the Checkout Journey Report.
This report is crucial for businesses that want to optimize their checkout processes and enhance overall conversion rates. In this blog, we’ll dive deep into what is included in the Google Analytics 4 Checkout Journey Report and how you can leverage it to improve your e-commerce strategy.
1. Overview of the Checkout Journey Report
The Checkout Journey Report in Google Analytics 4 (GA4) is a powerful tool designed to help e-commerce businesses understand and optimize their checkout processes.
This report provides a comprehensive view of user interactions as they navigate through the various stages of the checkout process, from adding items to the cart to completing a purchase.
Here’s an overview of what the Checkout Journey Report entails and how it can benefit your business:
Purpose and Goals
The primary purpose of the Checkout Journey Report is to give you insights into how users move through your checkout funnel. By analyzing this journey, you can identify areas where users drop off, encounter difficulties, or abandon their purchases.
The ultimate goal is to optimize the checkout process to increase conversions and enhance the overall user experience..
{{cta(‘147015123633′,’justifycenter’)}}
Get in touch to learn about Analytico’s Digital Analytics Audit services or GA4 audit services.
2. Key Metrics and Dimensions
The Checkout Journey Report in Google Analytics 4 (GA4) provides valuable insights into how users interact with your checkout process. To effectively analyze and optimize your checkout funnel, it’s crucial to understand the key metrics and dimensions included in the report.
Here’s a breakdown of these components and how they contribute to a deeper understanding of user behavior:
1. Key Metrics
1.1. Checkout Steps Metrics

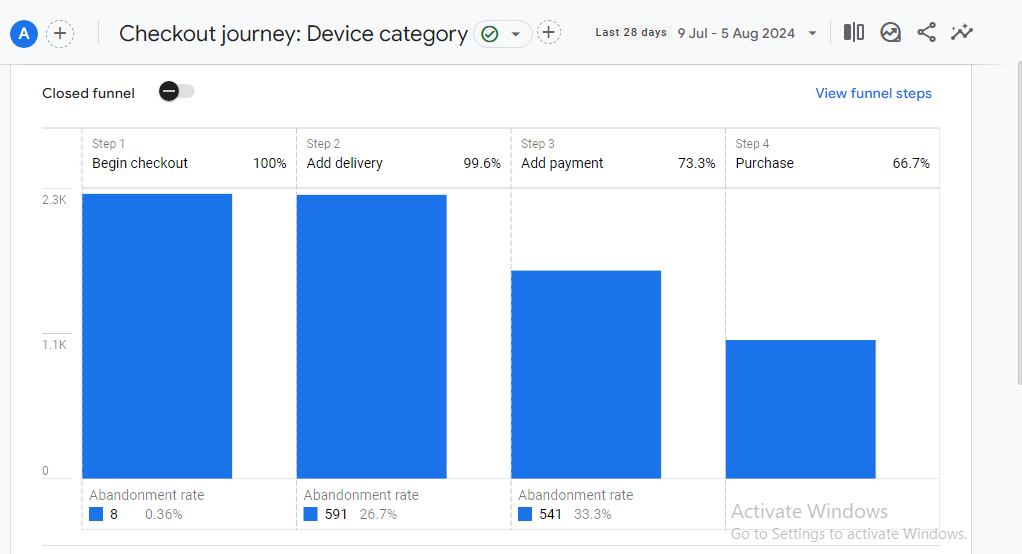
- Step Completion Rate: This metric shows the percentage of users who proceed from one checkout step to the next. For example, if 1,000 users begin the checkout process and 800 reach the payment information stage, the completion rate for that step is 80%.
- Abandonment Rate: This represents the percentage of users who drop off at each step of the checkout process. A high abandonment rate at a particular step can indicate issues such as confusing forms or unexpected costs.
- Time to Complete: This metric tracks the average time users take to complete each step of the checkout process. Longer times might suggest complexities or difficulties at that stage.
- Revenue by Step: This shows the total revenue generated at each step of the checkout process. It helps in understanding the financial impact of user behavior at different stages.
1.2. Conversion Metrics
- Conversion Rate: This is the percentage of users who complete the entire checkout process compared to those who start it. It’s a key indicator of overall checkout efficiency.
- Cart Abandonment Rate: This metric measures the percentage of users who add items to their cart but do not proceed to checkout. High rates can signal issues with cart usability or engagement.
- Purchase Completion Rate: This indicates the percentage of users who successfully complete the purchase after beginning the checkout process. It’s a critical metric for assessing the effectiveness of the checkout funnel.
1.3. User Engagement Metrics

- Engagement Time: This tracks the amount of time users spend on the checkout pages. Longer engagement times might indicate users are struggling with the process, while shorter times could suggest a smooth experience.
- Sessions per User: This metric shows how many sessions, on average, a user takes to complete a purchase. Multiple sessions may indicate a more complex decision-making process.
1.4. Financial Metrics

- Average Order Value (AOV): This measures the average amount spent per order during the checkout process. Increasing AOV can be a sign of successful upselling or cross-selling strategies.
- Revenue per User: This calculates the total revenue divided by the number of users who complete the checkout. It helps in understanding the financial value of each user.
2. Key Dimensions
2.1. Checkout Steps
- Step Name: The specific stages of the checkout process, such as ‘Add to Cart,’ ‘Begin Checkout,’ ‘Enter Shipping Information,’ ‘Enter Payment Information,’ and ‘Purchase Completed.’ Analyzing these steps helps in identifying where users drop off or get stuck.
- Step Sequence: The order in which users progress through the checkout stages. Understanding this sequence helps in mapping out the typical user journey and identifying bottlenecks.
2.2. User Segments

- Device Type: Information about the devices users are using, such as desktop, mobile, or tablet. This helps in optimizing the checkout process for different devices and improving user experience across platforms.
- Geographic Location: Data on users’ geographic locations, including country, region, or city. This can reveal regional differences in checkout behavior and help tailor the checkout experience for different markets.
- Traffic Source: Details on how users arrived at your site, such as through organic search, paid ads, social media, or direct visits. This helps in understanding how different traffic sources impact checkout behavior.
2.3. User Behavior

- Behavior Flow: Insights into the common paths users take through the checkout process. Analyzing these paths helps in understanding user preferences and identifying areas where users might be encountering issues.
- Event Type: Data on specific events or interactions during the checkout process, such as form submissions, button clicks, or error messages. This can help in diagnosing specific issues within the checkout flow.
2.4. Temporal Dimensions

- Time of Day/Week: Data on when users complete checkout or abandon carts, such as during specific times of day or days of the week. This can provide insights into peak times and potential patterns in user behavior.
- Session Duration: The length of time users spend in a session during the checkout process. Analyzing session duration helps in understanding user engagement and identifying potential obstacles.
3. Visualizations and Flow Diagrams
The Checkout Journey Report in GA4 often includes visualizations such as flow diagrams, which illustrate how users move through the checkout steps. These visualizations can highlight:
- Funnel Visualization: A graphical representation of the checkout funnel, showing the number of users at each step and the drop-off rates between steps. This helps in visualizing where users are leaving the checkout process.
- Path Analysis: A detailed view of the common paths users take through the checkout steps, which can uncover patterns in user behavior and preferences.
- User Flow: A representation of user movements through the site, from the landing page to the checkout steps. This can provide insights into how users interact with other parts of the site before reaching the checkout.
4. User Behavior Insights
Understanding user behavior is key to optimizing the checkout process. The Checkout Journey Report provides insights into:
- Common Drop-Off Points: Identifying where users are most likely to abandon their carts or the checkout process allows you to focus on improving those specific areas.
- Device and Browser Performance: Insights into how different devices or browsers affect the checkout process can help in identifying technical issues or optimizing the mobile checkout experience.
- Impact of External Factors: The report can also reveal how external factors such as promotional offers, shipping options, or payment methods influence checkout behavior.
{{cta(‘168359013192′,’justifycenter’)}}
5. Actionable Recommendations
Based on the insights gathered from the Checkout Journey Report, businesses can take several actions to improve their checkout process:
- Optimize Checkout Steps: Streamline the checkout steps to reduce friction and make the process as simple as possible.
- Improve Form Usability: Address issues related to form fields or input requirements that may be causing users to abandon their carts.
- Enhance Mobile Experience: Ensure that the checkout process is optimized for mobile devices, as many users shop on their phones.
- Test and Iterate: Use A/B testing to experiment with different checkout designs or processes and analyze their impact on conversion rates.
- Address Technical Issues: Fix any technical glitches or performance issues that may be affecting the checkout experience.
6. Integration with Other Reports
The Checkout Journey Report is not an isolated tool but works in conjunction with other GA4 reports. For instance:
- User Acquisition Reports: Understand where users are coming from and how their source affects the checkout process.
- Behavior Reports: Analyze how users interact with your site overall and correlate this with checkout behavior.
- Conversion Reports: Measure how changes to the checkout process impact overall conversion rates and revenue.
Conclusion
The Google Analytics 4 Checkout Journey Report is a powerful tool for businesses looking to optimize their e-commerce checkout processes. By providing detailed insights into user behavior, conversion rates, and abandonment points, it enables businesses to make data-driven decisions to enhance their checkout experience.
Leveraging this report effectively can lead to increased conversions, reduced cart abandonment, and ultimately, higher revenue. Regularly analyzing and acting on the insights from the Checkout Journey Report can significantly improve your e-commerce performance and customer satisfaction.


